The 2012-2013 coffee experiment

Here’s a slightly different sort of blog post: I’m going to share some of the results from my year-long coffee experiment.
As many of you know, I’m an avid coffee drinker and can’t go very long without the stuff. It’s very much an addiction/dependence, but I’m okay with it. It turns out that out of all of the non-essential things we ingest on a routine basis (alcohol, medication, recreational drugs, etc), caffeine is one of the safest and most useful. At some point I’ll write up a full blog post talking about what caffeine does (tl;dr version: it’s an adenosine receptor antagonist), but for now just take my word that it’s awesome, or else we’ll have to agree to disagree.
I drink my coffee black, without any adulteration from milk, cream, sugar or what have you. I will occasionally compromise on milk if it’s already been made and offered, but not on anything else. I also drink a fair bit of it, although not an excessive amount by most people’s standards (I drink 2-3 large cups on an average day). Actually, to be precise, an average day for me consists of 2.679 cups of coffee, plus or minus .099 cups at a 95% confidence level. How do I know this? As it turns out, from March 2012 to the end of February 2013 I kept track of my coffee intake, every day, for one year. I got the idea from my friend Tereza, who kept track of her coffee and beer consumption in parallel for some period of time (I forget how long)- I was more interested in the coffee part, but I wanted enough data that I could actually run some real numbers; no sample sizes of one week. So beginning in March of last year, I started a coffee log and decided at some point that a year was a good enough sample size to work with. (No, I didn’t do a power calculation. If that was your first thought, go away.)
Methodology: at the end of every day between March 1, 2012 and February 28, 2013 (or sometimes the following morning) I made a simple tally of how many ‘units’ of coffee I consumed during that day. Importantly, one ‘unit’ here is independent of size- a small espresso or a 20-ounce Venti from Starbucks both count as one. The reason I specifically chose not to classify by size is that I didn’t particularly care about my total dosage of caffeine (which would vary by size, type of brewing method, etc) but rather about the discrete number of times per day that I felt sufficiently compelled to drink a coffee that I took the time to make one/buy one and drink it. I tried my hardest not to let the fact that I was recording my consumption patterns influence my coffee drinking in any way- I’m not trying to quit, after all, I’m trying to learn things. Finally, the one important exception I made to the ‘one coffee = one tally’ rule is in restaurants (particularly breakfast places) where your cup is being refilled constantly, I counted one coffee consumed for every two refills. Other than that, though, each tally represented one distinct consumption of a coffee beverage.
Results:
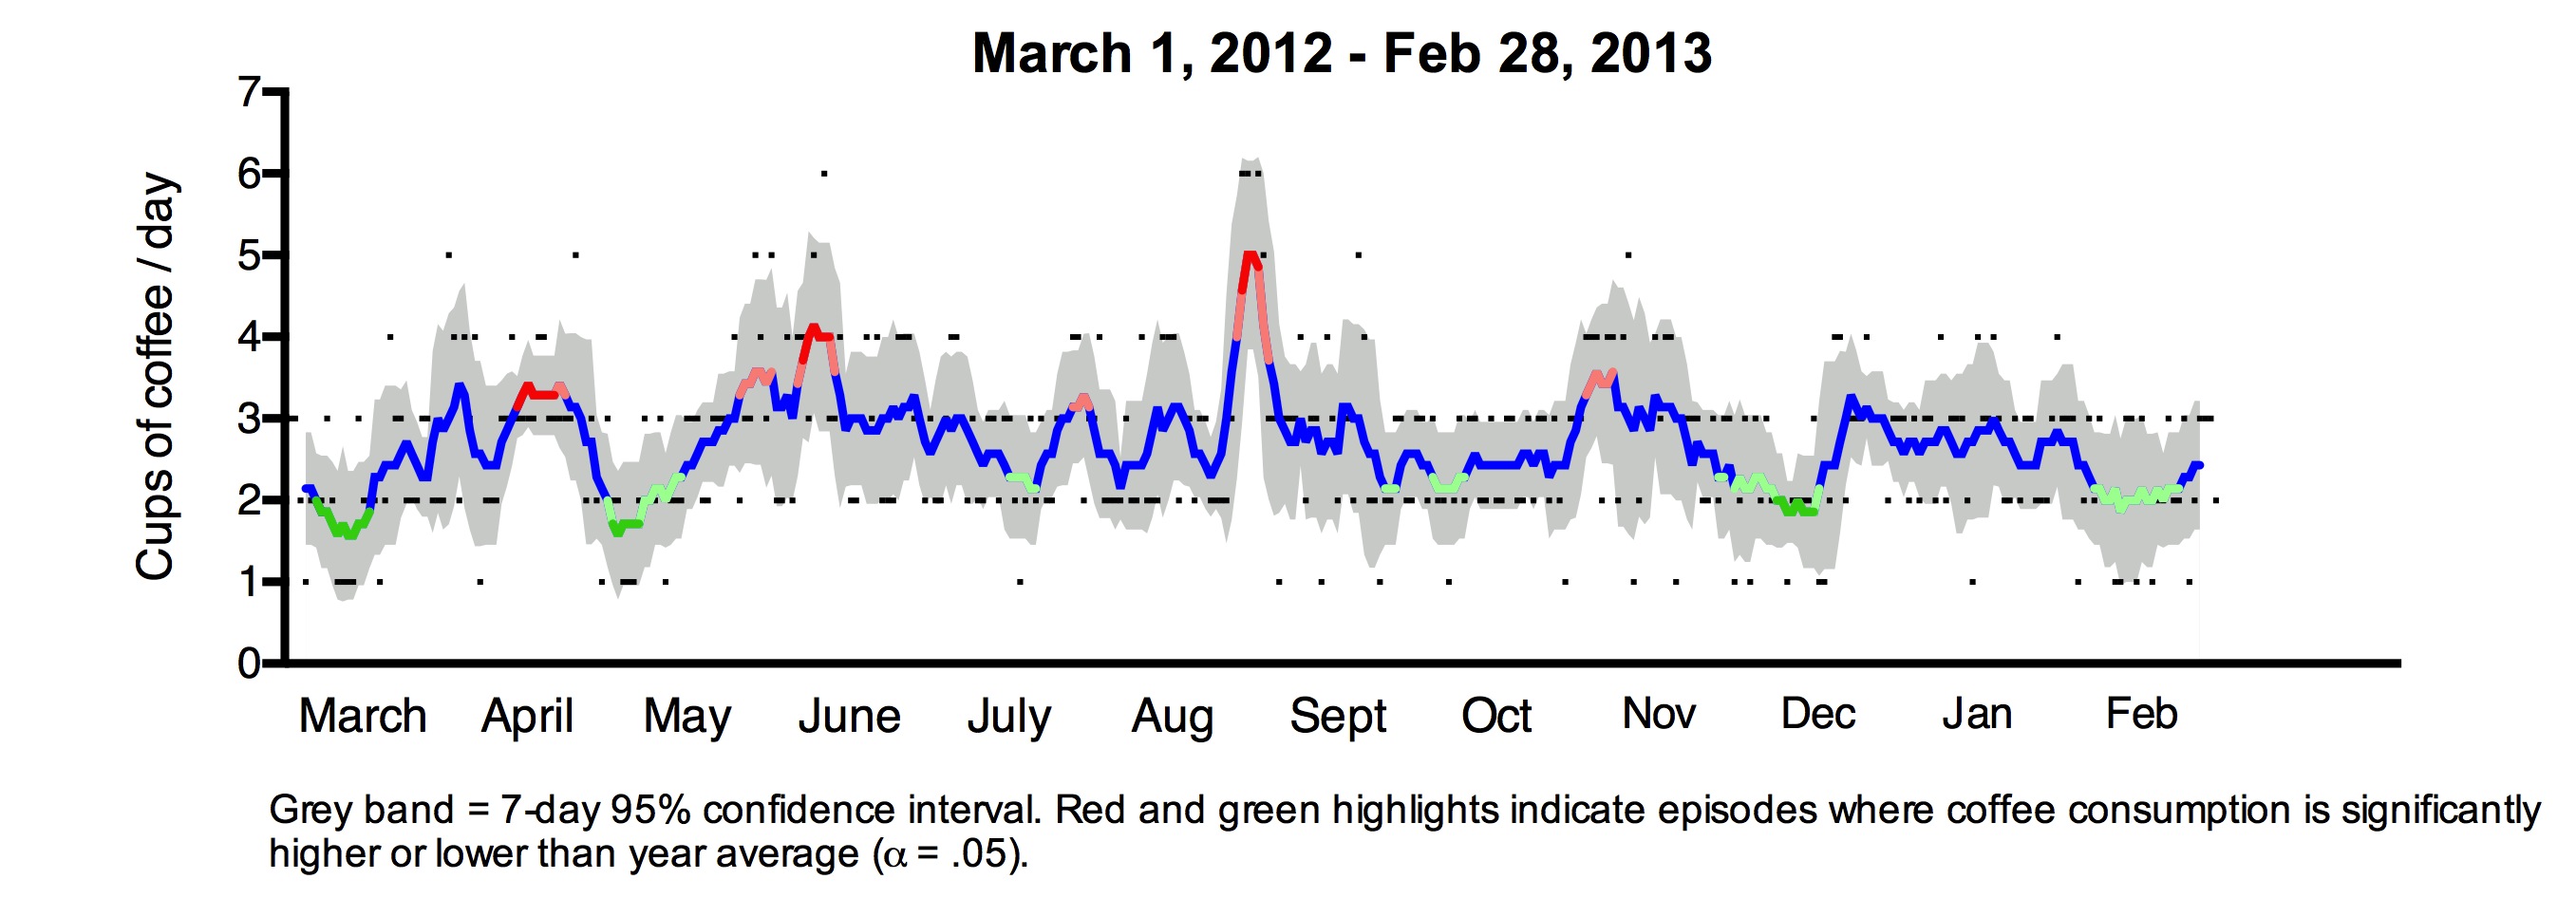
Figure 1 above shows my coffee consumption over the one year recorded: each black dot represents one day, and the blue line is the seven-day rolling average. The blue line becomes green or red during periods where coffee consumption is significantly lower or higher (at a 95% confidence level) than average. Visually, you can see that there aren’t too many of these periods, and none of them stand out too highly except for one week, at the end of August, when I was in Milan for a conference and espresso flowed like drinking water. Other than that though, this looks a lot like randomly generated data: there aren’t any obvious patterns emerging from the noise.
A few descriptive statistics, before we start looking any deeper: as mentioned earlier, my mean value of coffee consumption was 2.679 cups per day, with a standard deviation of .968 cups/day and a 95% confidence interval of 0.099 cups/day. The range of values extended from 1 to 6: I never exceeded 6 cups in a day over this year, nor did I ever go an entire day without coffee. There was not much month-to-month variation.

Figure 2 shows what happens when you break results down into weekdays and weekends: as anticipated, there is a small shift towards less coffee consumption on weekends but not a massive one. The range and spread is still essentially the same, although the number of one-cup days is significantly higher on weekends than weekdays (Fisher’s Exact test; p < .001).

In Figure 3, you can see at left that the effect of day-of-the-week is small but significant (accounting for 8.7% of total variation by one-way repeated measures Analysis of Variance (ANOVA); error bars are SD). However, a standard multiple comparisons test (Tukey’s) does not show any significant difference between any particular combination of weekdays except that I drink significantly more coffee on Wednesday than on Sunday (q = 4.695; 36 df; p < .05). Other than that, nothing significant pops out. However, if you specifically look at days where I had only one cup of coffee and days compared to days I drank four or more, you can see a very visible difference in the distribution of weekdays. Shouldn’t be too surprising, but I think it’s neat to see.

The last thing I looked at, shown in Figure 4, was the effect of traveling. During that year I was in a band that went on tour with some regularity, which involved a lot of driving around in the band van and usually not much sleep. I also went to a few conferences to present research from the lab, where flying time, jet lag, and general disorientation might necessitate increased coffee consumption. So I split my data set into travel days and home days, and sure enough there is a pretty pronounced increase on travel days (two-tailed Mann Whitney, p < .001). If you look at the distribution of cups per day, again there is a strong shift towards more coffee on the road; in fact, every single 6-cup day was while traveling (which isn’t a huge surprise).
So overall, what did I learn? Probably the most surprising finding for me was the consistency of the data: I expected quite a bit more variation than I ended up seeing, and I did not expect to see that I have either 2 or 3 cups of coffee essentially 3 out of any 4 given days (74.79% of the time, to be precise). I was also a bit surprised that there were so few significant peaks and troughs in the 7-day rolling average- again, apart from the occasional road trip the data looks like it could have been randomly generated noise. Which is kind of neat, in a way- sometimes the fact that there is no signal in a data set is just as interesting as if there had been one. Maybe some time in the future I’ll run this experiment again, to see if anything changes with age, or as a non-student, or whatever- but for now I’m enjoying not having to keep track of every cup of coffee I drink. It got a bit tedious.
