Startups are not normally distributed
We often observe things in life that are normally distributed. The familiar Bell Curve can be seen in the distributions of people’s heights, weights, and blood pressure, their marks on an exam or IQ test, or the varying sizes of items produced by machines. The normal (Gaussian) distribution is relatively easy to understand, which is part of why we’re taught about it so much in school: a collection of observations of a certain feature will have some average value, and will be distributed around that value (possibly skewed to one side or another) in an elegant, predictable manner. They’re very nice to work with because, well, they’re normal.

The fact that normal distributions exist everywhere isn’t a coincidence: in fact, we have a pretty good idea of why they’re so common. Whenever we examine a collection of observations (for example, people’s heights) that represent the sum of a very large number of small, contributing factors (in this case, the thousands of hereditary and environmental factors that all make small contributions to someone’s height), where these factors are for the most part either independent of one another or at most additive, Gaussian distributions naturally arise. We’ve known this for some time; Harold Jeffreys articulated this notion in 1938 when talking about errors in measurement surrounding a central value, but it’s equally true for the distribution of data around some population mean:
“The normal or Gaussian law of error rests partly on a particular hypothesis about the nature of error, that the error of any individual observation is the resultant of a large number of comparable and independent components; and partly on comparison with frequencies in actual series of observations.” –Harold Jeffreys
One part of the world where we (very frequently) talk about distributions of measurements where each measurement represents the sum of thousands of smaller factors is in business. When you look at a company’s revenue, market cap, profit, and other ‘sum-of’ metrics, you’re looking at numbers that represent the net result of a huge number of small decisions and executions. This is especially true in existing markets where business models are well known, and success depends largely on talent, execution, and not making any big mistakes. Unless something goes catastrophically wrong (or bizarrely well), business expectations and results typically fall within a normally distributed range. And that’s fine.
You know where this doesn’t apply at all? Startup world. Startups are different.
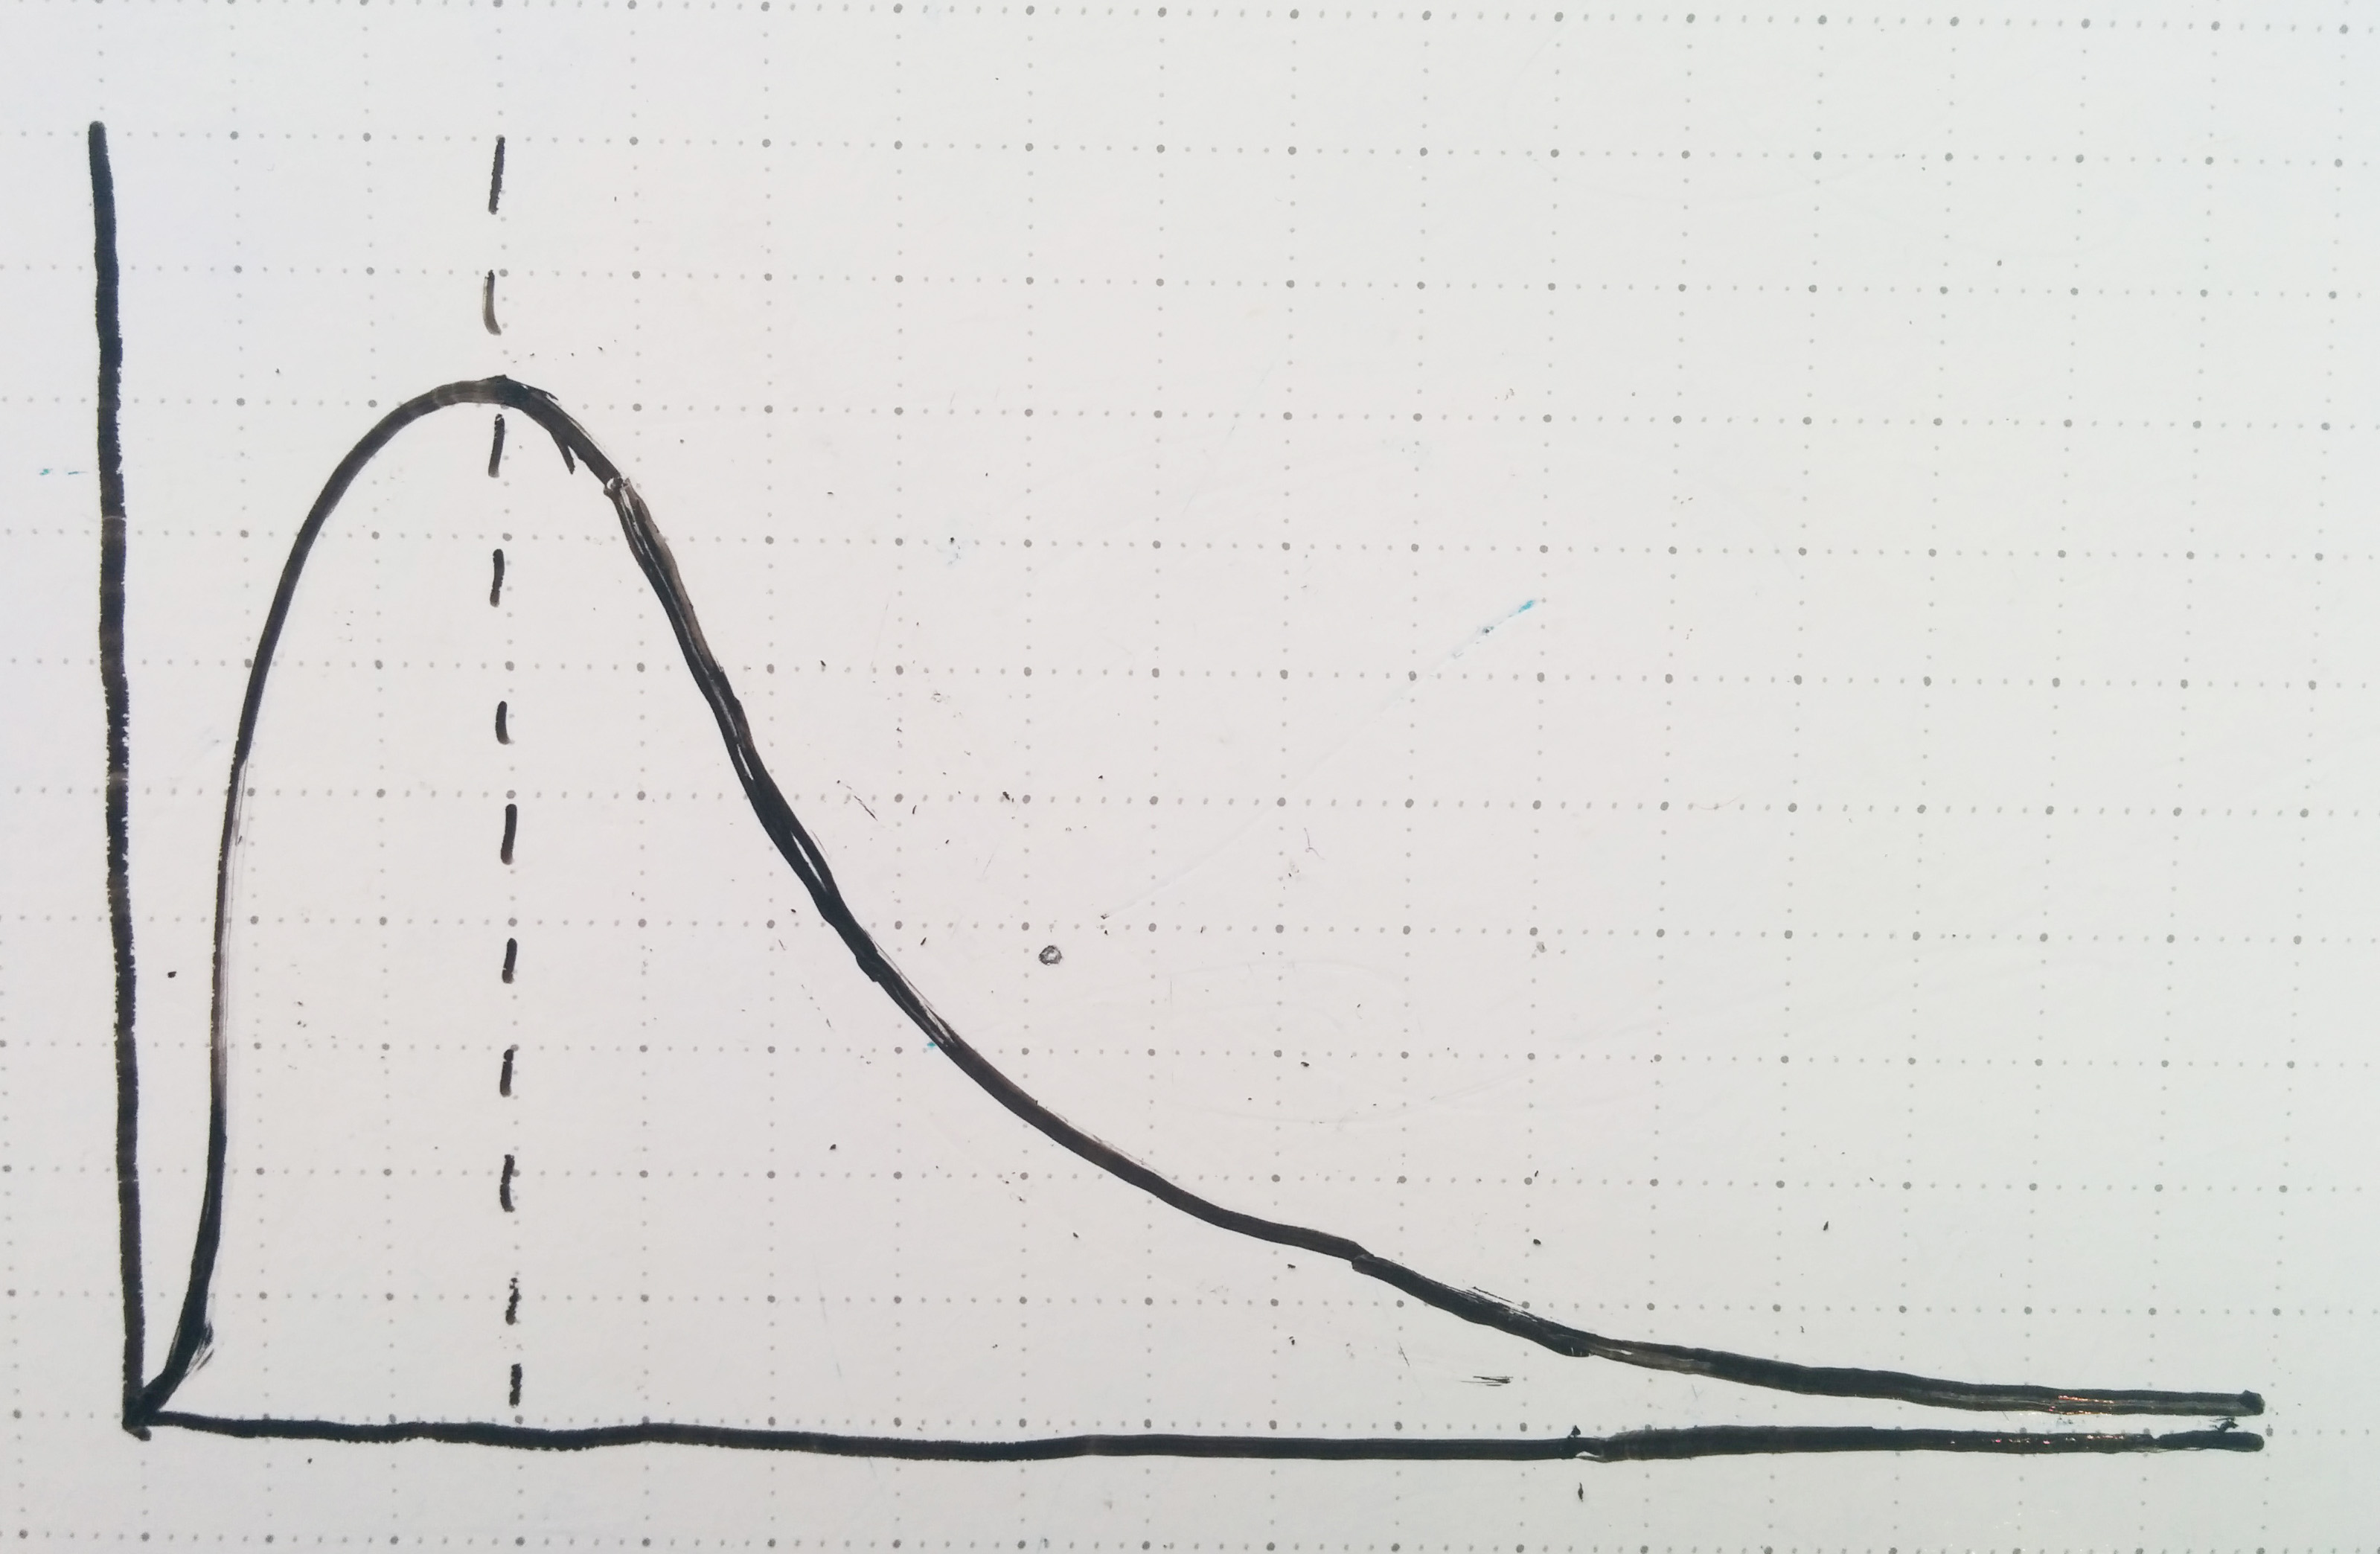
For startups, the default expectation is zero: you’re trying to escape the default with a radical, innovative business model where you know a secret that no one else has picked up on yet. If you’re running a startup (especially a venture-backed one), success isn’t a function of linearly adding lots of little pieces: if stars align in just the right way, you get hyper growth; otherwise, it didn’t work. You’re looking for (radical idea) x (innovation) x (execution) x (super fast growth) to line up exactly the right way and get a huge, explosive result. And here’s the thing: Gaussian distributions don’t describe those kinds of outcomes well at all. Sure, there are a lot of little pieces involved, but the ‘average’ result carries a very different meaning: the average startup is a failure. Non-failures are relatively rare events. We need a different kind of curve to explain what’s happening: something a little bit closer to the F Distribution.
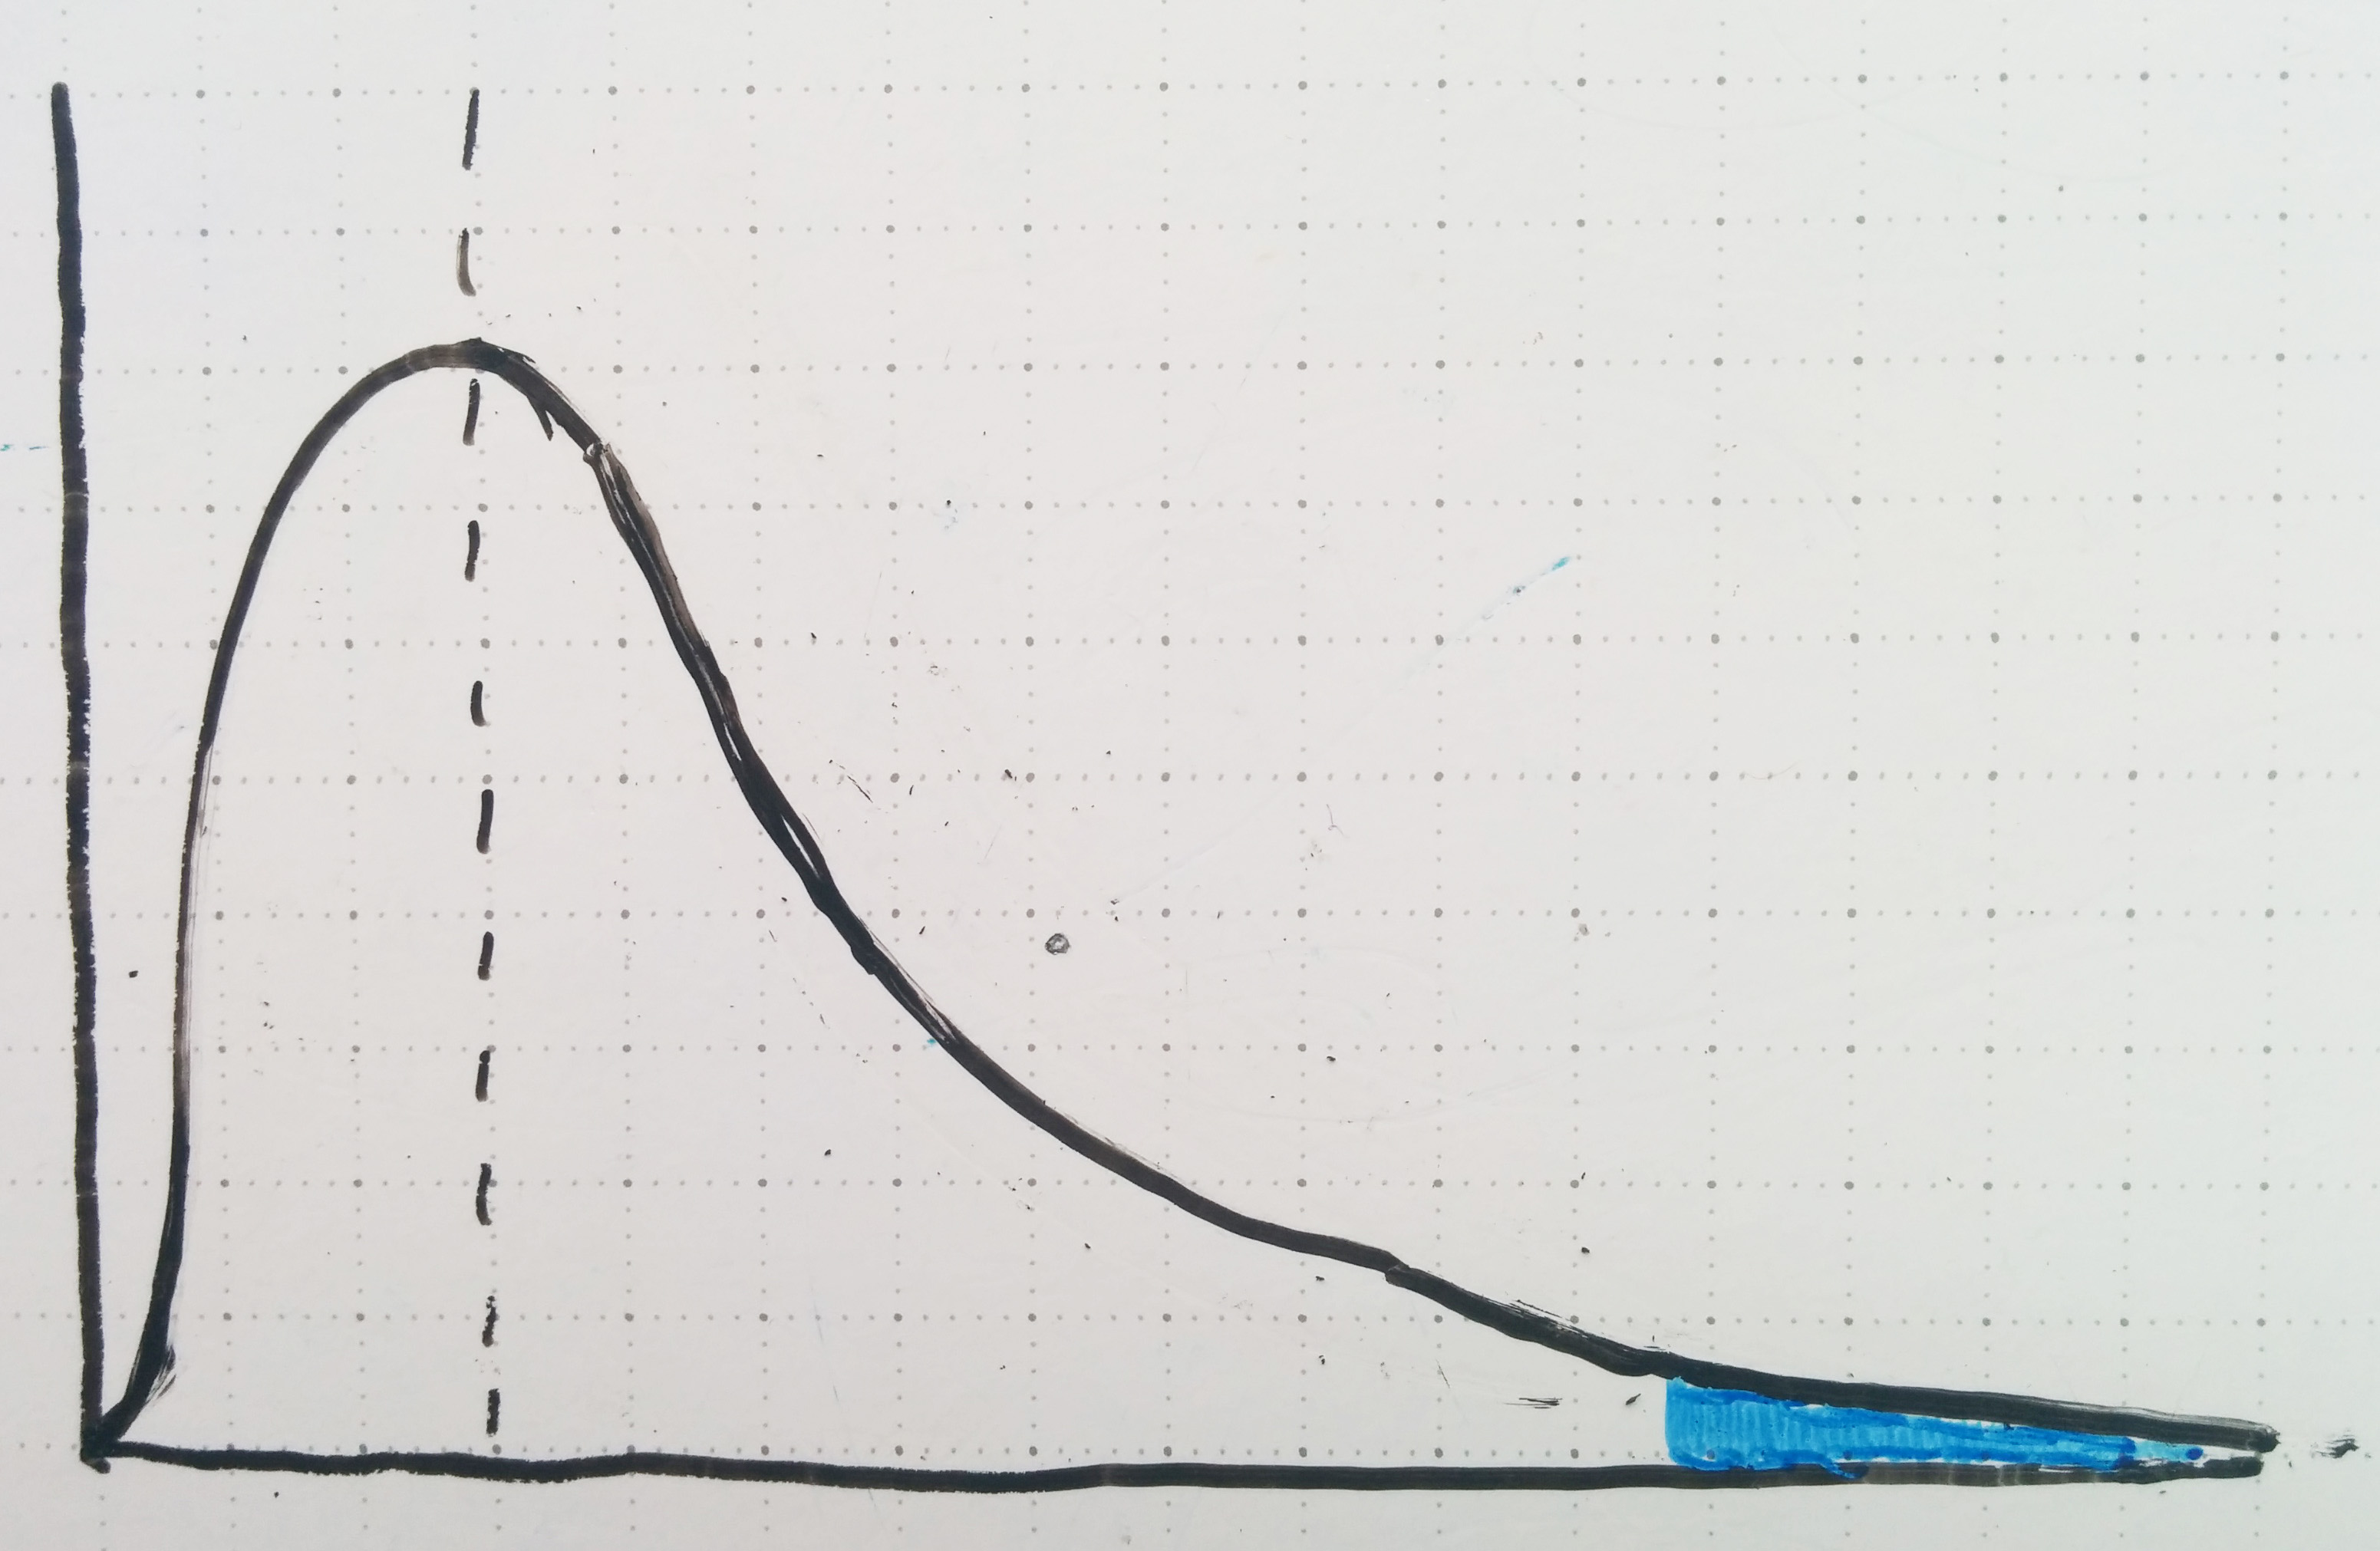
So if this curve better describes what the startup ecosystem looks like, how does one go about identifying the good ones? I think it’s an interesting coincidence that in the startup world we frequently hear about how “95% of startups fail”, while in science, the standard level of confidence required to reject a null hypothesis is typically set at 95%. In other words, for a startup to be successful it has to stand out from [the total distribution of attempted startups] like so:
Given the probabilistic similarities between picking hot startups and rejecting null hypotheses, I’m surprised that neither founders nor investors typically adopt a ‘Reject H0 approach’ to drawing conclusions. When founders pitch their vision, investors analyze company metrics, and the tech media talks about numbers (not exactly their forte) I constantly see information presented in the form: ‘Here is evidence of why company X has a good idea / is doing well’. In normally distributed business environments, where most of the variables are known and many little pieces add linearly, that can be a good approach. But in startups? You’re basically making a case that looks like this:
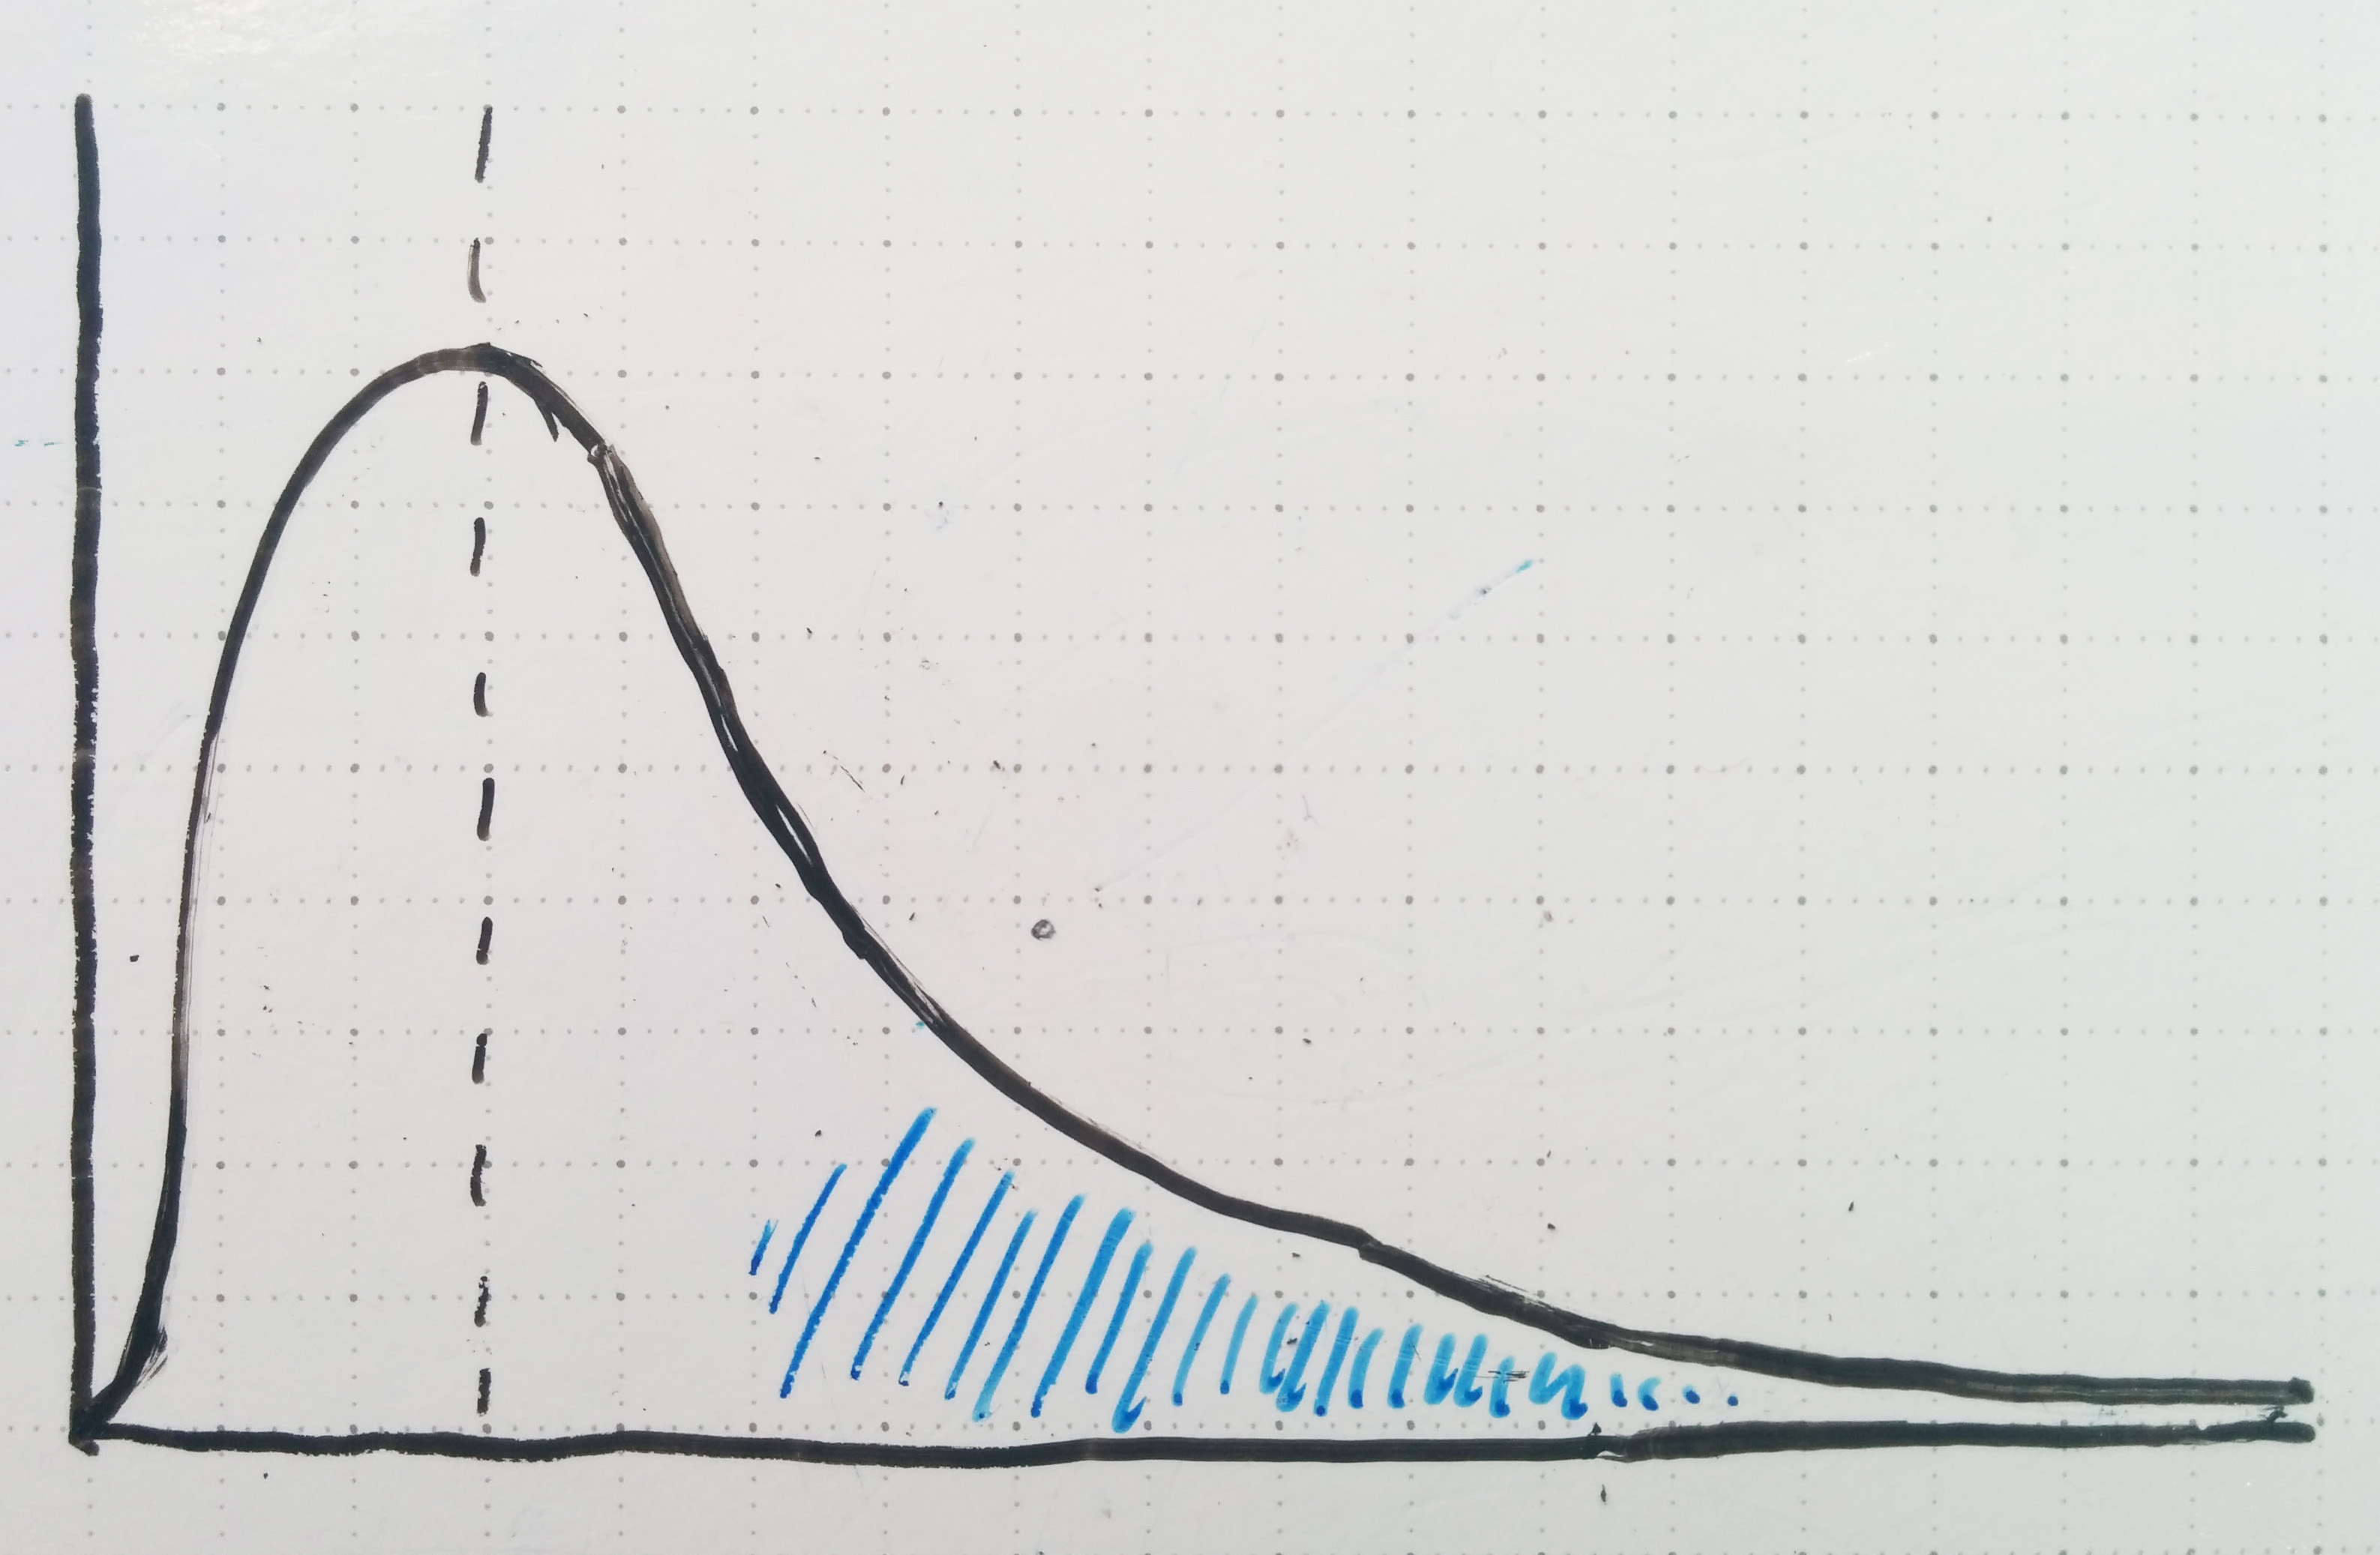
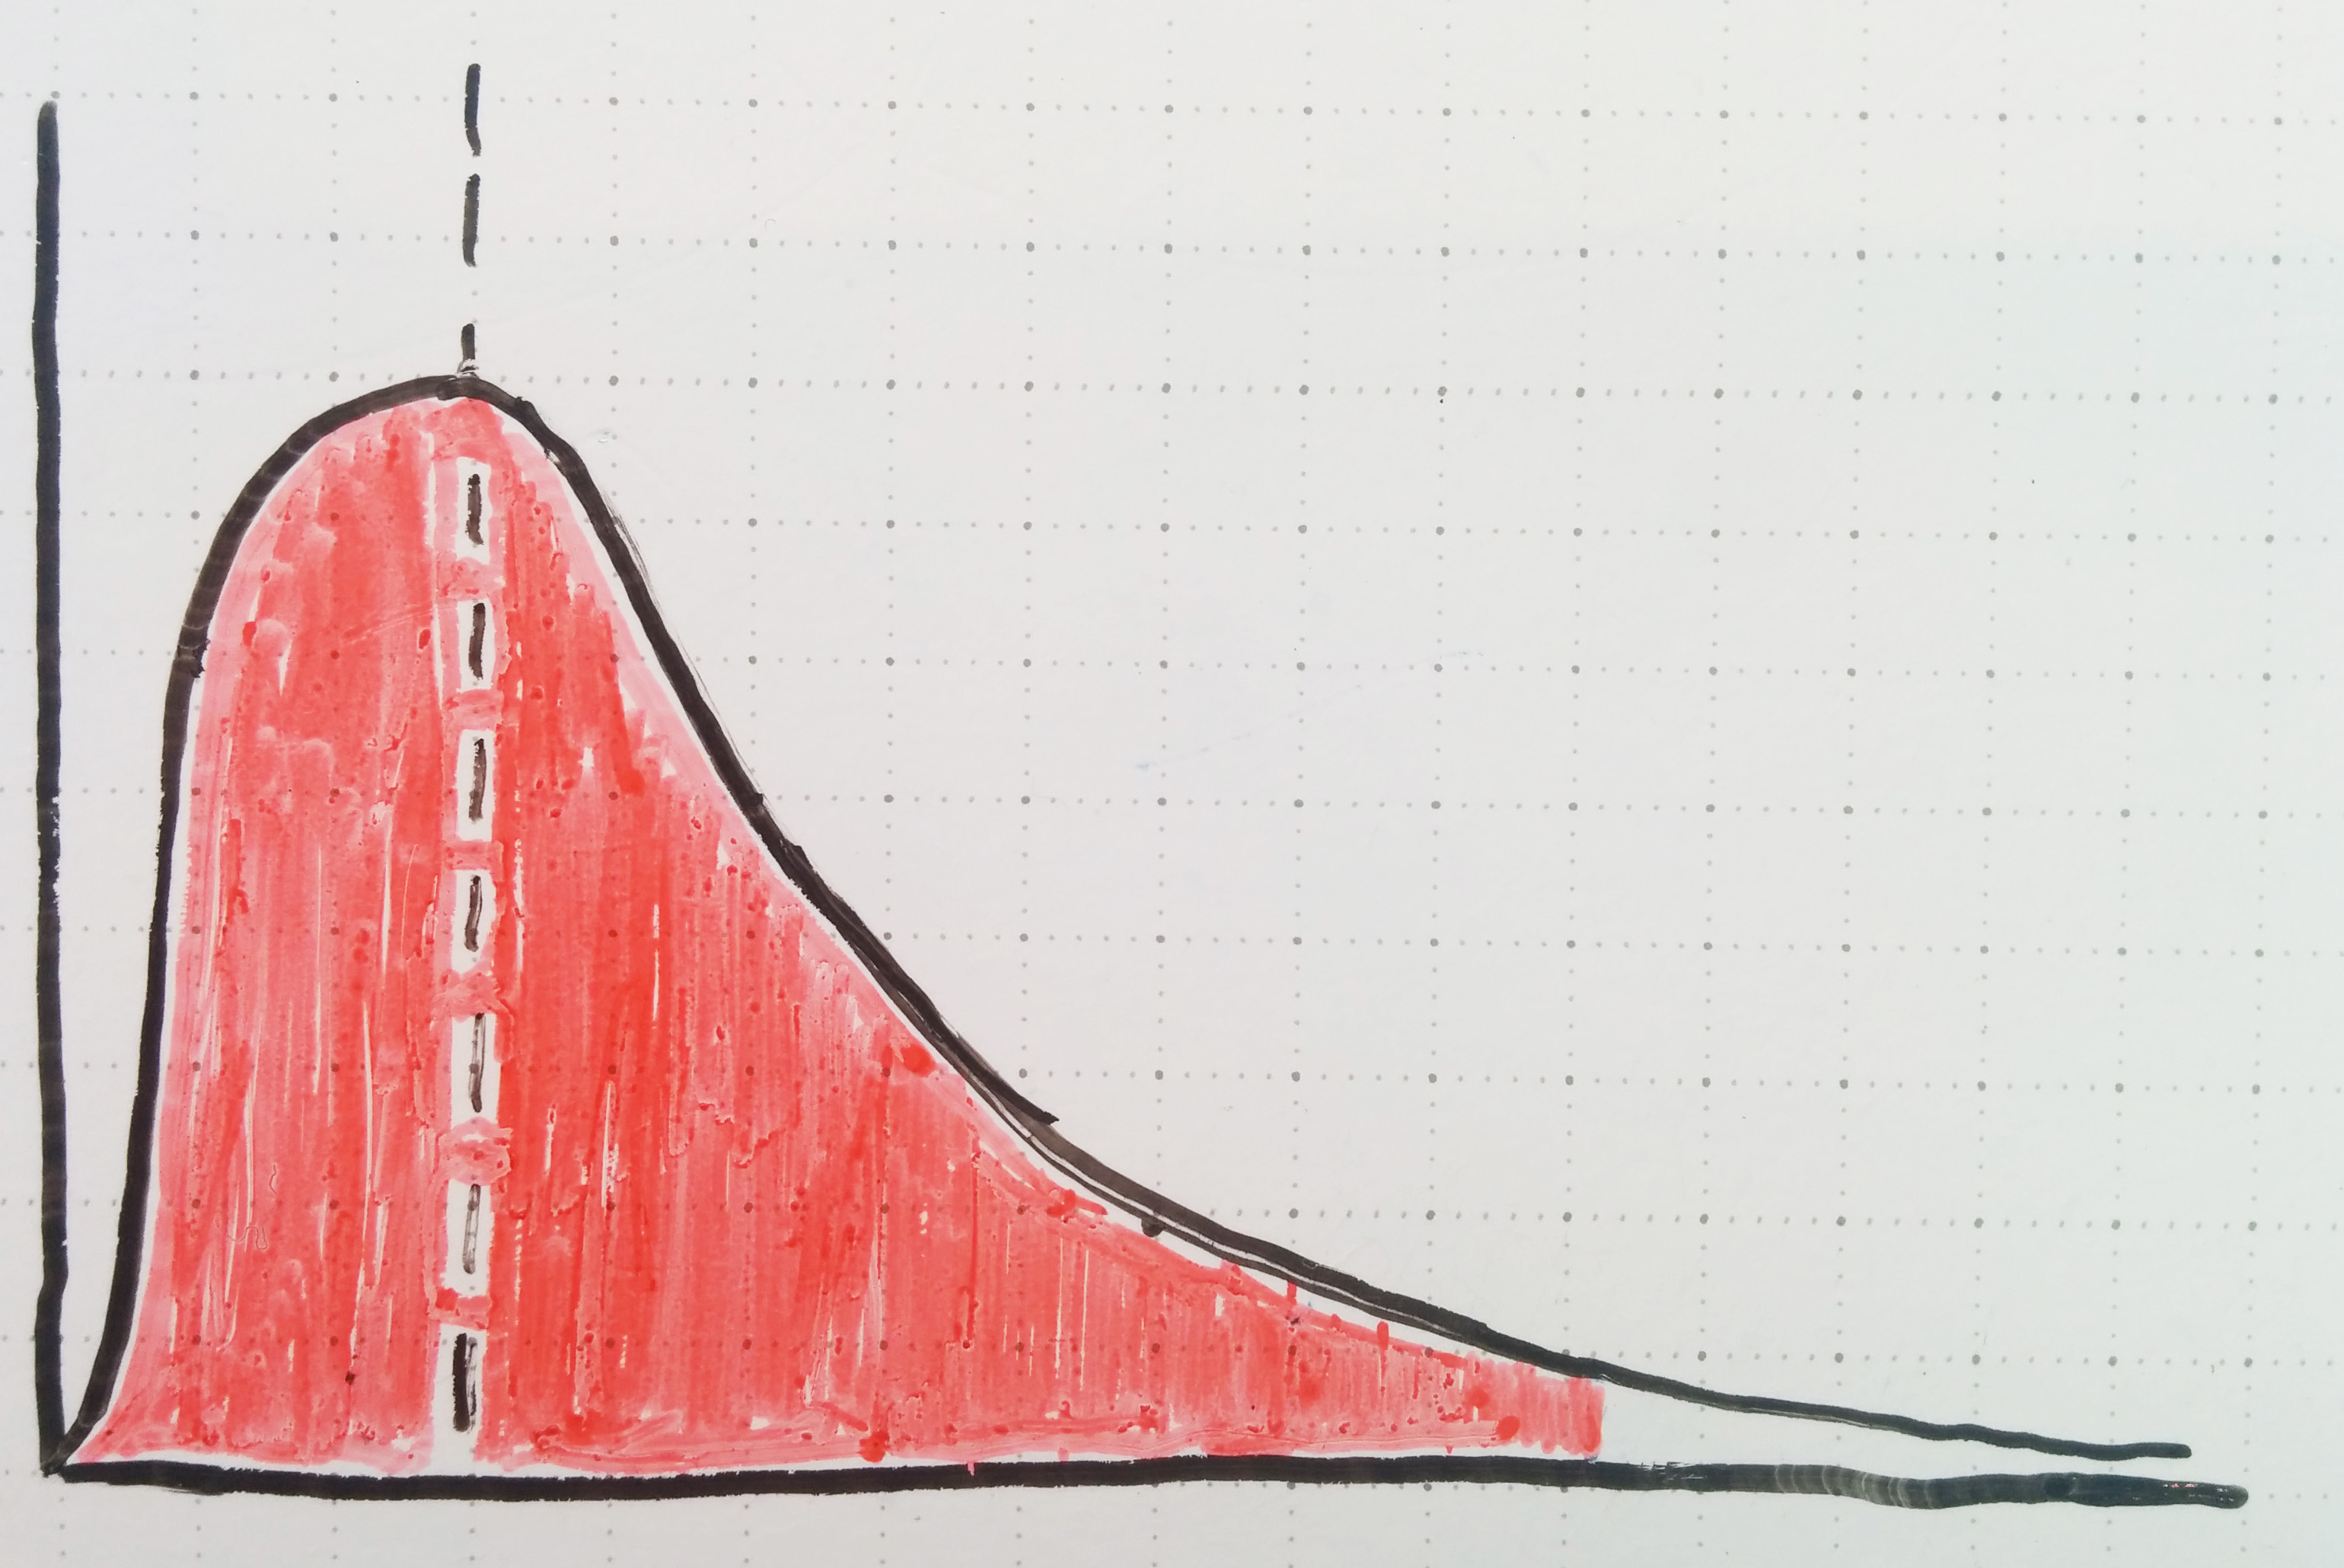
Sure, it makes the case that Company X is better than average. But that doesn’t carry much meaning when ‘average’ just means failure, and better than average could very well mean ‘delayed failure’, or ‘failure but only after a bunch of investor money was sunk into it’.
So what’s the solution? I think the startup community needs to borrow a bit of data discipline from our scientific neighbors. Specifically, I think we need to begin looking at startup opportunities in terms of null hypotheses to be rejected. How do your pitch, metrics and investor reports show that you’re not in the 95% of startups that will fail? What makes you different? What makes you the exception?
In a world where opportunity isn’t normally distributed and ultimate success is a rare event, it’s not enough to show evidence of a good opportunity or good execution. Go the extra mile: help me reject the null hypothesis that your startup will end up like they normally do. Show me why you’re not in the 95% who fail. Dare to be strange – you’re a lot more likely to emerge above the crowd than if you’re shiny and pretty just like everybody else.
